7.18.0678 |
  
|
7.18.0678 |
|
Released on October 8, 2019
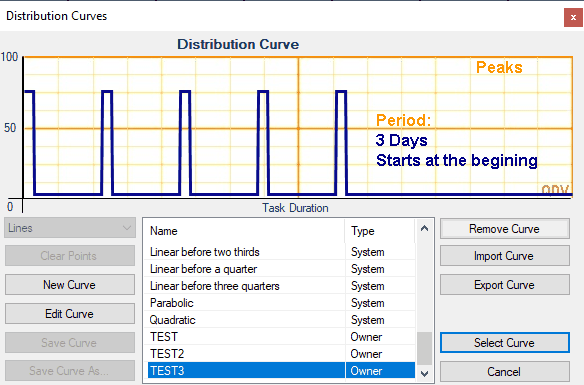
A new type of distribution curves named ‘Peaks curve’ is available. It’ll be of help when you need to set up resources at regular intervals, E.g.: periodic maintenance.
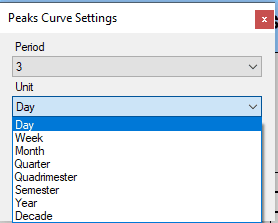
When you define such a curve, you provide the interval, the unit in which the interval is expressed and you tell whether the first peak must occur at the very beginning of the period or after one period.
You can use following units to express your interval:
A peak is always calculated internally using the smallest available period of time (it always lasts one day) whatever the period of the time-frame used.
You can either use a period smaller than the time-frame period (so you’ll have several peaks in a time-frame period) or a period larger than the time-frame period (you’ll have one peak every X time-frame period).
Notice that durations are all calculated based on years having 365.25 days (a month is 365/12 days, a week is (365/12)/7 days, etc.).
As for any other type of curve, the peak curves take into account the possible shift in the start period: If your first period starts in the middle of the month and your time-frame period is ‘Months’ then, if your curves is set to give one peak every week, you’ll have only two peaks in the first period.
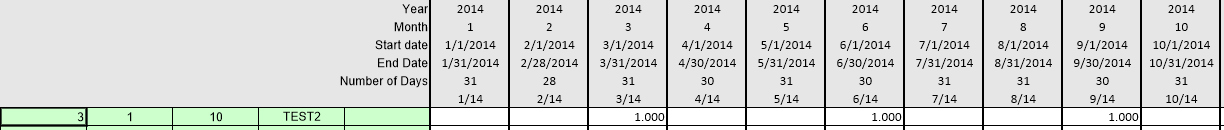
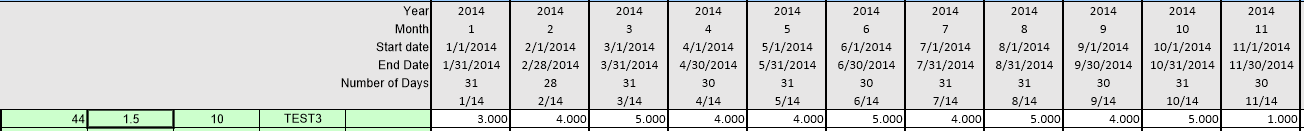
Below are some examples with a duration set to 10 months:
1.Curve has a peak every week and starts at the beginning. Main period is ‘Months’
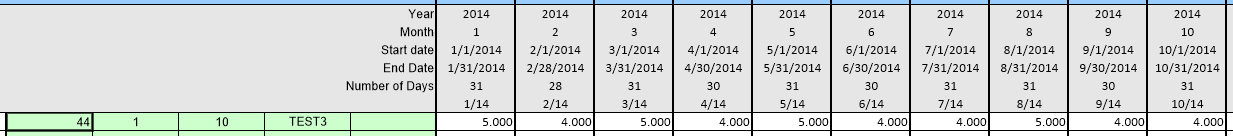
2.Curve has a peak every 3 months and starts at the beginning. Main period is ‘Months’
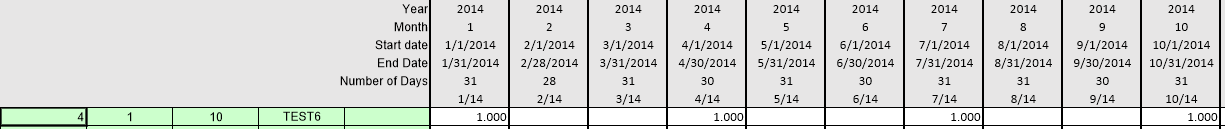
3.Curve has a peak every 3 months and starts after one period. Main period is ‘Months’
4.Curve has a peak every 7 days and starts in the middle of first month. Main period is ‘Months’. The shift at the beginning overlaps month #11
The API has been extended to support new peak curves: a new signature of the function SplitValueAccordingToCurve() let you provide the unit of the time-frame receiving data. Other curves do not need that but because a peak curve has its own unit, you must provide the unit in which you want the function to return data. The new signature is as follows:
Public Function SplitValueAccordingToCurve(value As Double, periodsCount As Integer, firstPeriodPart As Double, endPeriodPart As Double, unit As PeakCurveUnit) As Double()
When a set is disconnected from the database of the estimate by deleting the reference in the minutes view and this set has references to other sets, it can happen that the result is not correct. In this case the set depth of some rows can be wrong.
The new property IQdvEnvironment.UserData property was added for sharing data among macros.
The new property ActiveEstimateContext was added to the ICallingContext interface. It gets the context of the active estimate if any. There may be an active estimate even if the current calling context is for a non-estimate object, such as a database of sets. This property is useful for macros in, for example, database of sets. It provides access to the active estimate. This way, for example a macro in a sets database knows into which estimate a set was dropped and into which row and column in the Minutes or WBS.
When a set is disconnected from the database of the estimate by deleting the reference in the minutes view and this set has references to other sets, it can happen that the result is not correct. In this case the set depth of some rows can be wrong.
New Features:
Export to Excel. Now you can export the page color.
Enhancements:
We completely redesigned the style selection menu in Ribbon. Now styles are displayed in several columns for easy viewing.
Fixed Bugs:
Some issues with position of the report checker in some situations.
Improvements to parsing patches in maps - support for multiple values for the parameters H, h, V, v.
The StiOptions.Engine.ReportResources.ResourcesPath property now works properly.
Export to Image. The exception occurred if ImageType=Grayscale.
When using Html tags or Wysiwyg TextQuality, Font Fallback now works.
An exception when compiling a report if ReportLanguage=VB and the logical operators "and", "or" are used in the arguments of aggregate functions.
A stackoverflow bug with some reports.