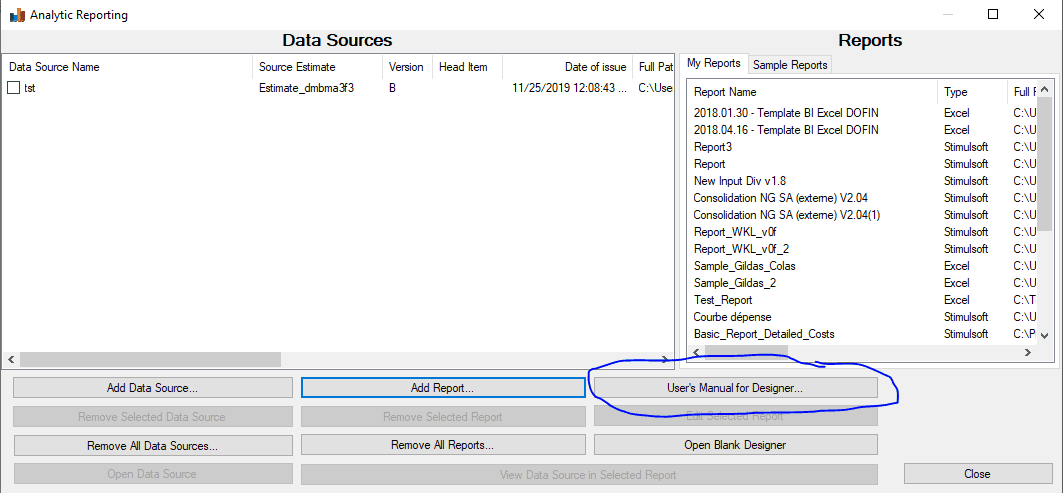
7.19.0705 |
  
|
7.19.0705 |
|
Released on December 9, 2019
When in the report editor of the Business Intelligence tools (Menu View / Analytics - Ultimate Edition only) you can go to the insert tab and click the new Dashboard button.
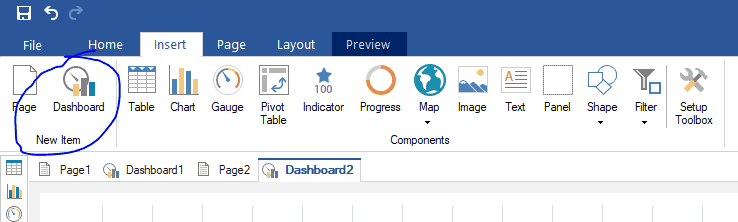
This let you create dashboards or enrich your reports with dashboards. Below is a dashboard sample:
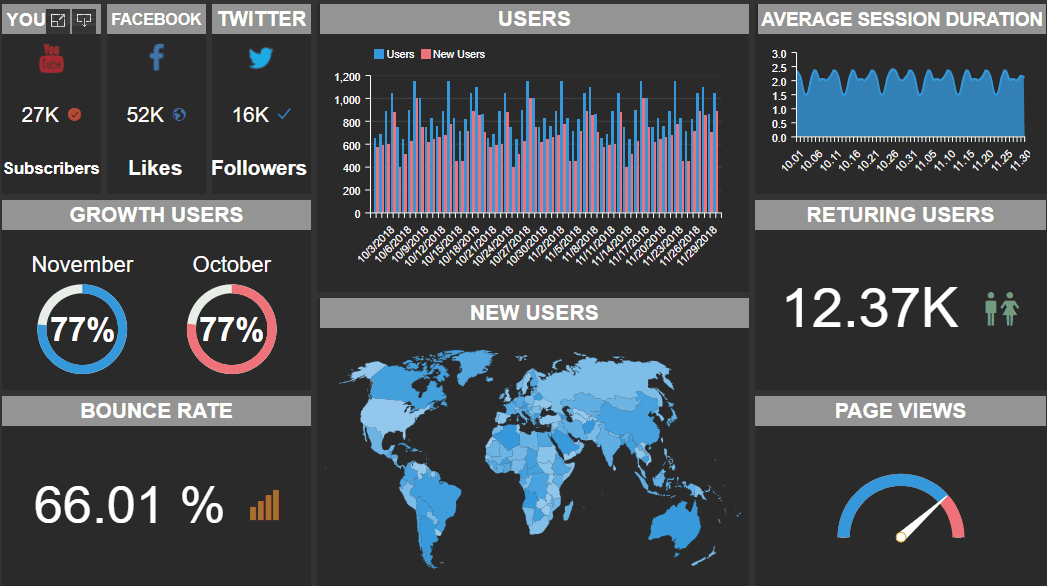
You can use a lot of specific components on your dashboards:
•Charts
•Tables
•Gauges
•Pivots
•Indicators
•Maps
•Progress
•Filters
•Images
•Texts
•Shapes
You can mix up with regular report pages.
See documentation here for further information: