Released on April 26, 2020
This new method displays standard QDV window with a list of anomalies.
The issue was introduced in QDV beta 7.19.748.
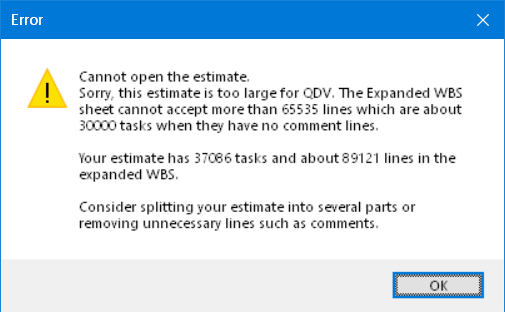
QDV cannot handle more than 65'535 physical lines in the Expanded WBS worksheet. This is the limitation of Excel 2003 and older. If such a large estimate is opened, QDV reported several errors and failed. Now, it correctly detects the problem and provides the information to the user.

Such large estimates could be created from large XLSX files with previous versions of Converter.
In some very rare cases, the Object reference not set to an instance of an object error could be displayed when opening an estimate.
Two new periods have been added to time frames: Semesters (6 months) and Quadrimesters (or Quad: 4 months). Due to the limitation to 75 main periods in the time-frames, using these new values as sub-periods enables times-frames as long as:
•24 years with Quadrimesters (24 * 3) = 72
•36 years with Semesters (36 * 2) = 72
Note: Cash flow always use months and is limited by the size of Excel XLS worksheet (255 columns where only 240 are left for periods). So, whatever the unit used for periods in a time-frame, the cash-flow data sheet can only take into account the 20 first years (20 * 12 = 240).
When a time-frame has more years, the remaining costs, quantities or times are consolidated in the very last period of cash-flow data sheets.
Possible compatibility concern: We didn’t want to create a new format for QDV files but we have to store specific flags for the two new periods. So, when you use these new periods under the new version of QDV and open your estimate in an older 7.18 or 7.19 version, nothing is displayed in time frame and cash flow until you adapt to a period supported by older versions.
So far, when a mixed time-frame was used it was a bit confusing because in the minutes, total quantities were not displayed, in the time-frame sheet of the overhead quantities were displayed escalated and, in the resources, listed at the bottom of cash-data sheets, quantities were not escalated.


That was suitable to most of operations but it was not flexible. You may want to escalate the quantities or ensure you never escalate the quantities (only escalate the costs). Also, you may want to see your total quantities in the minutes, particularly when they are escalated.
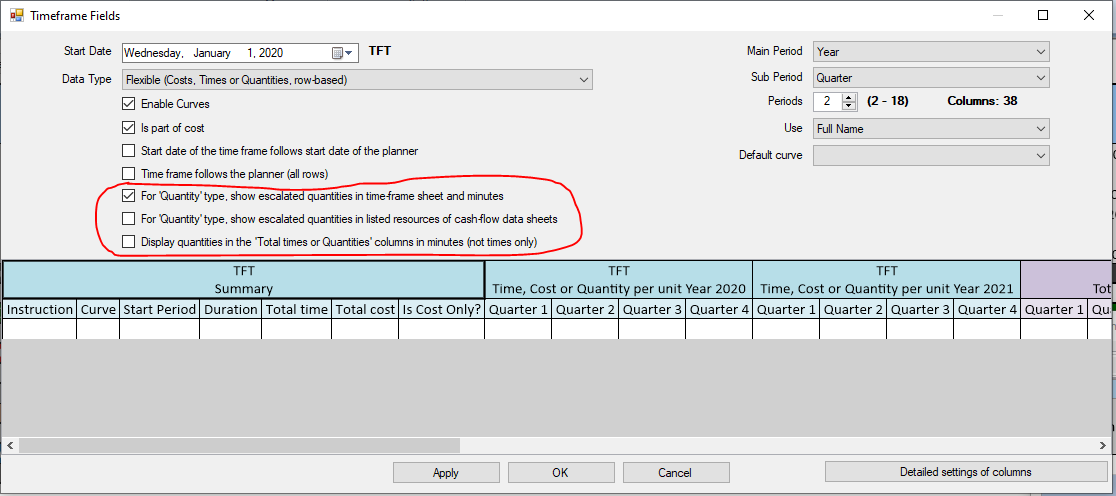
To bring this flexibility, we have added 3 check boxes to the Time-Frame definition form:

When you open an old estimate or create a new one from scratch, the values of these check boxes appear as above shown. Meaning that the estimate behaves exactly as before (show escalated quantities in time frame sheet, show non-escalate quantities in listed resources and do not show total quantities in the minutes).
But now you can change this behavior. Let’s say we want to see the total quantities in the minutes, just check the last box and you get:

Of course, you can still check the no-escalation flag. When you do this, you would get:

You can see escalated quantities above. Now let’s say we don’t want to escalate the quantities:

You get in the minutes:

In the overhead Time-Frame sheet:

In the resources list:

Note: Possible compatibility issue: We didn’t want to create a new format for QDV files but we have to store specific flags for these 3 new check boxes. So, when you use these new check boxes under the new version of QDV and open your estimate in an older 7.18 or 7.19 version, the old mode is taken into account, regardless the values of the check boxes (these boxes do not appear in older versions).
Following recent extensions of listed references and descriptions, the following options didn’t work with SQL Server databases.

This is now fixed and you can use these features with SQL Server or SQLite databases. Either articles or sets.
So far, any user was able to adapt the bottom panes of minutes or nomenclatures. Because such operation affected bottom panes for all users, including administrators, we’ve removed the ability to bring change to bottom panes for users meaning that only administrators of estimates can do it.
When inputting figures in new QUANTITY_NUMBER column, values between 1 and 1.5 were interpreted as 1.