Released on December 7, 2021
The Ultimate Edition has been enriched with a new application in the QDV Tools For Excel: Gantt.
This new application let you create a Gantt diagram based on the WBS.
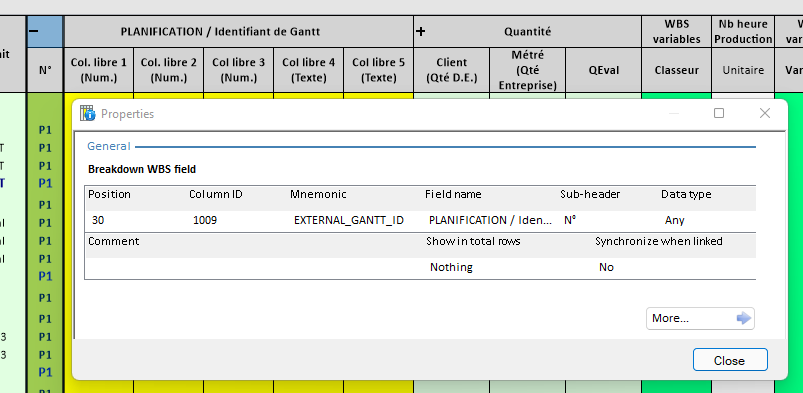
To use it, just add a new special column named EXTERNAL_GANTT_ID (listed in the special columns of the minutes fields manager) and display it in the WBS (as a breakdown field, coming from the minutes)

Then, in the corresponding list of the overhead, input some IDs:

With this, you can tell which WBS task goes to which Excel Gantt diagram.
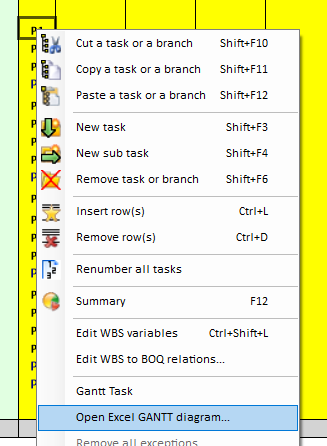
Then, locate your cursor on the Gantt ID you want to open (in the WBS) and right click and selectn Open Excel Gantt diagram

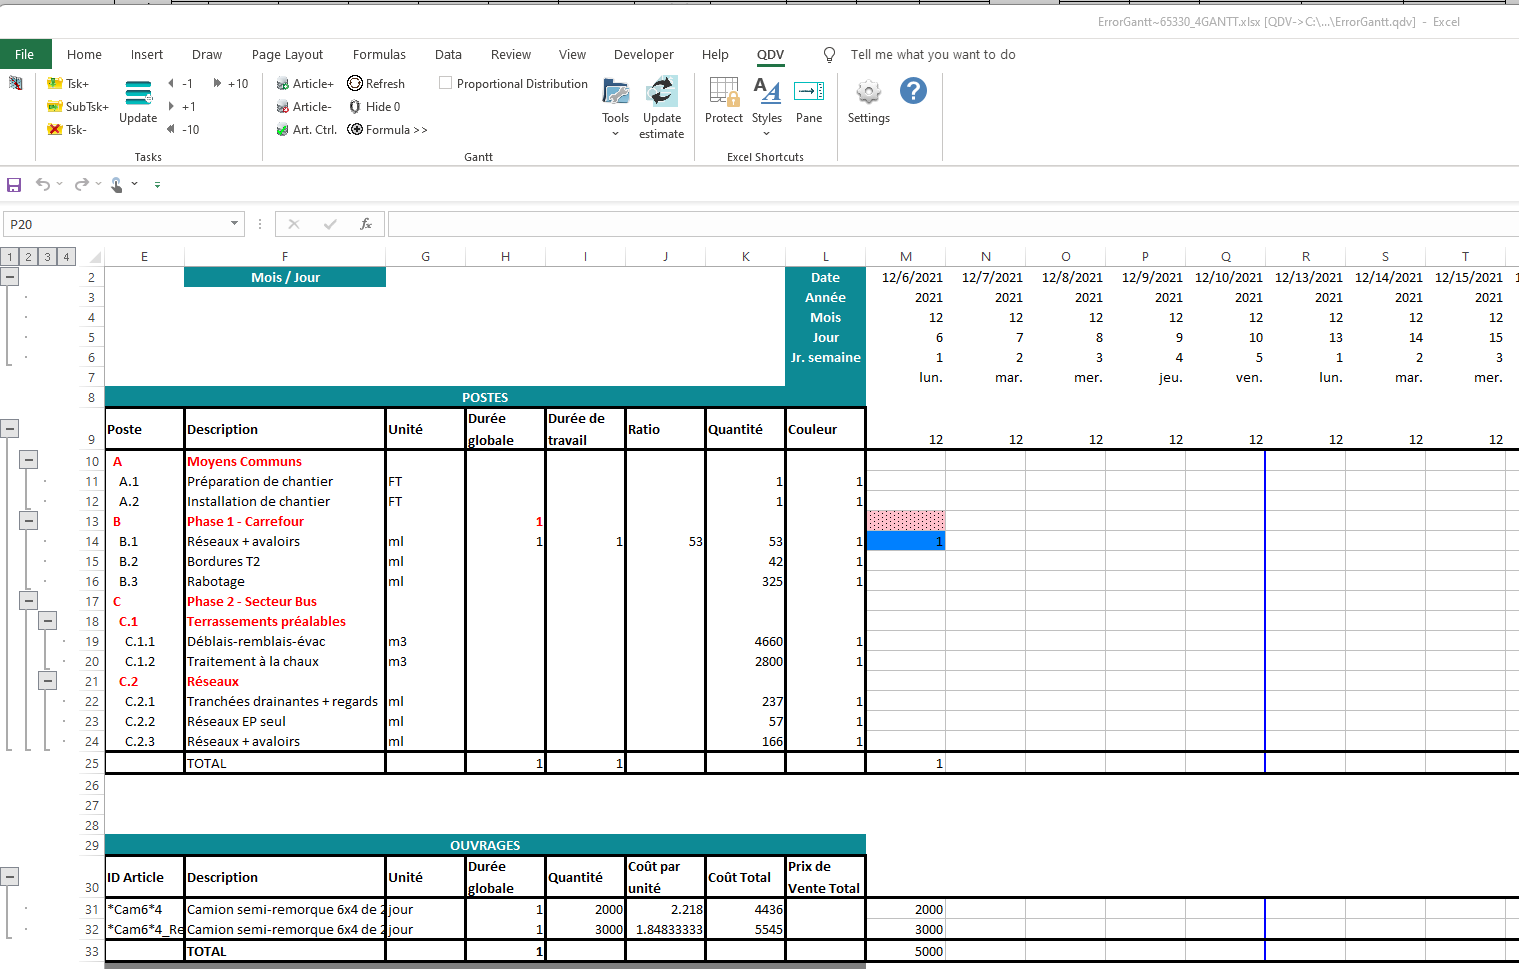
You’ll get a Gantt diagram under Excel based on the WBS tasks:

In the Excel application, you can add tasks and import resources from the database of the estimate. Using formulas, you can assign quantity to these resources bases on the periods of the Gantt. These resulting quantities with their resources are pushed back to the corresponding minutes.
This is simple way to work with a Gantt diagram for specific WBS tasks and feed the minutes with the result.
Notice that this new feature requires a database of the estimate so that you can import resources in your Excel Gantt diagram.
We’ll provide you soon with complete documentation for this new feature.