Released on June 9, 2022
Previously, when you used auto-list function, if the field reference of Set contained special characters, the Set was not imported in the Minute. It’s fix.
A powerful genetic algorithm has been implemented to optimize resource usage in large Gantt diagrams. You can stat it by clicking this new button (From the Planner tab):

The goal of this solver is to allocate resources at best so that they are used at their maximum possible. It can move tasks, superpose works taking into account all constraints.
E.g.: In our third sample, let’s set some dependencies between tasks:

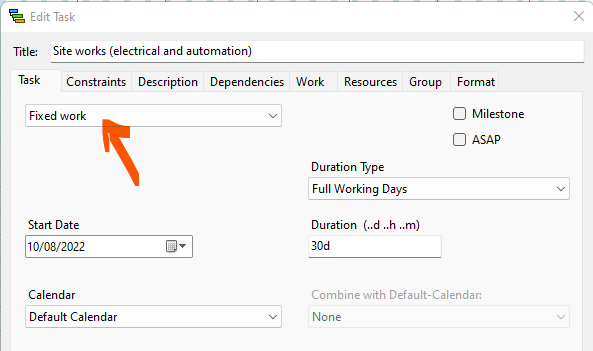
Set all tasks, to ‘Fixed Work’ instead of ‘Static’ so that their duration can be adapted according to available resources. The only one we keep ‘Static’ in this example is ‘Purchasing equipment’ because this one doesn’t depend on the resources we provide.

Let’s create some resources automatically by clicking the ‘Adjust Resources’ button:

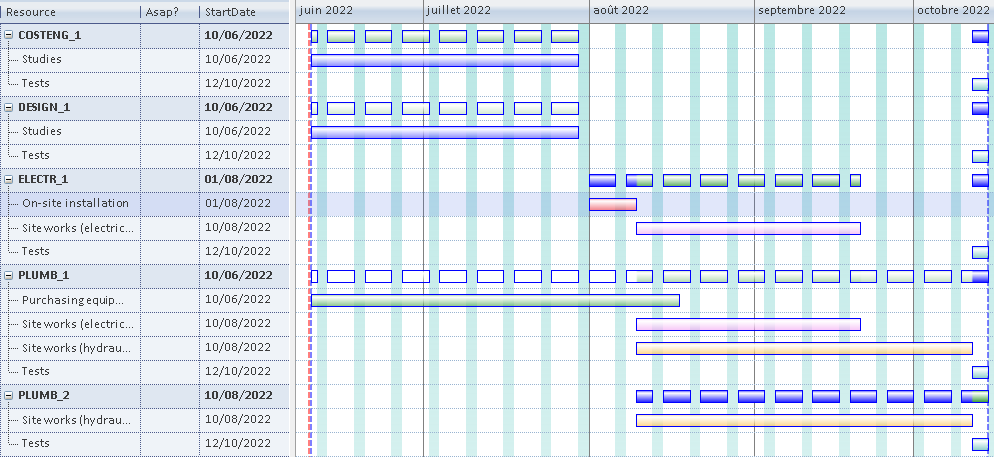
We get 1 cost engineer, 1 designer, 1 electrician and 2 plumbers because the design of our Gantt diagram requires 2 plumbers to achieve some tasks. This leads to following resources chart:

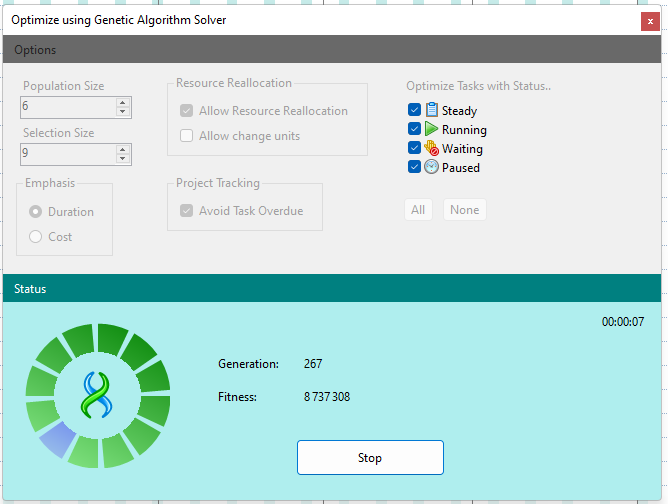
Let’s see if we could optimize the diagram taking into account all constraints and dependencies assigned to tasks. The overall time is about 5 months for the project. Let’s click the optimize Gantt button and run with default options:

Wait a few seconds to have up to, say 400 generations. It’s the number of generations created, you start from several parents (as defined in Population Size), they create children (one generation) who create grand-children (second generation) and so on, with each generation we study a possible optimization. The more generation we have the more cases we have studied. Then, when you click ‘Stop’ we check for the most optimized cases and we apply them to Gantt diagram. Each generation take into account all constraints and dependencies for each task.
The larger the generations, the larger the fitness meaning than more possibilities are studied.
You can cancel you changes by clicking the ‘Undo’ button.
In our example, after optimization, we reach a 4.4 months long project:

The resources chart too, gets optimized:

We’re still working on it and it will be improved in the coming months.
Notice that this new feature is available only in the Ultimate Edition of QDV because lower editions doesn’t support resources.
The ability to export to ProjectPlanner (what was named Export XML in the menu) has been removed from the menu because the project is discontinued and the application won’t work under recent Windows versions. The publisher decided a few years ago to cancel the project. So, we started developing a new planner component derived from their initial component. Our component contains much more features like ‘WBS and Waterfall diagrams, Hammock tasks, etc.) so we cannot maintain the compatibility with the old project planner application.
However, you can still export to Microsoft Project and we’ll extend this bridge to support most of the features.
When you insert in your minutes the column QUANTITY_X_QWBS, the heading row of the minute was left blank for this column. Now you can see the WBS quantity in the top row for this field.