7.22.0955 |
  
|
7.22.0955 |
|
Released on March 20, 2022
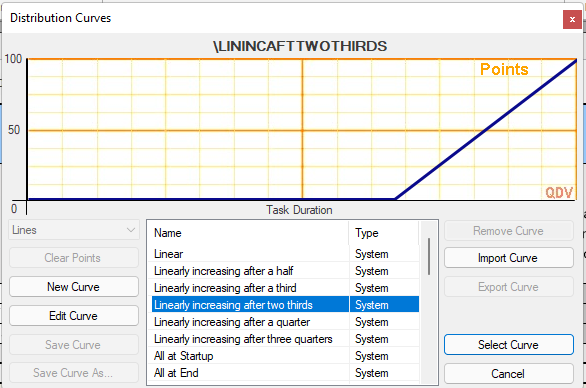
The list of distribution curves visible in the ribbon displayed only the name of the curve. Now it also displays its ID so that you can easily identify the curve in the minutes where IDs only are visible in time-frames.
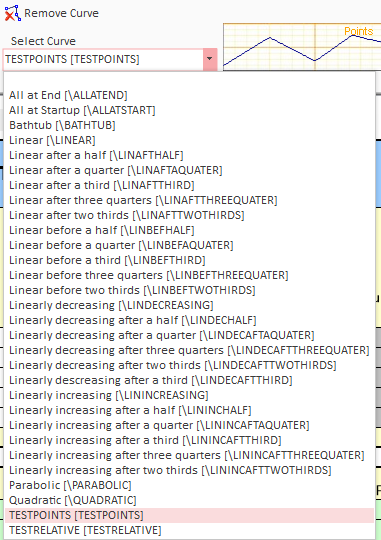
Now you can see the ID of the curve being displayed above the curve:
When you inserted a task with its own group (all created at once) with the following dialog:
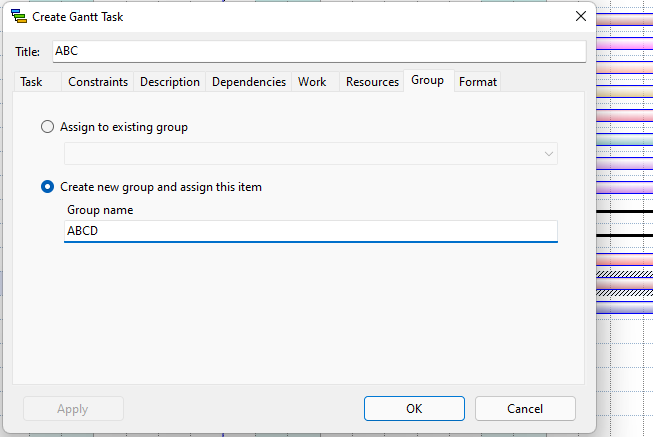
The group would go automatically on top of the diagram exactly as what is done when you insert a group alone (without task). However, that was confusing because when you insert a task without its group, it takes place right below the selected task.
Now, the newly created group and its task come at the right place, below the selected task.
Of course, this applies only to WBS-type Gantt diagrams because with Waterfall-Type Gantt diagrams, the groups and tasks are positioned vertically according to their start date.
Keep in mind that you can easily rearrange your tasks in a WBS-Type Gantt diagram by manually entering the line number expected in the first column. This action moves the lines and renumber all lines.
In the report generator, you get crisscross patterns when you attempt to display a column which is not allowed in your profile (when you’re not an administrator of the estimate). This is intentional because the administrator may want to hide data to users. Any column not allowed or dependent of a non-allowed column displays crisscross patterns instead of figures.
However, when the user creates a progress statement, some columns may become hidden automatically because they are set to be visible in estimate only (not in progress statements).
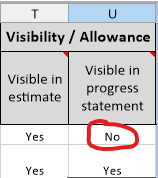
So far, such columns were displayed with crisscross patterns in the report generator but they are not really confidential because the user can see their values if he goes to the “estimate” mode instead of the “progress” mode.
For this reason, we decided to change that and the figures of such columns are now displayed normally also in progress mode in the report generator.
QDV memorizes locally the last opened tab for each estimate so, when you reopen the estimate on the same computer if opens directly on the last tab activated. This feature is convenient but probably not a good idea when the last tab activated is the report generator.
When you open the report generator, it always opens by default the latest report used, regardless the estimate. So, you may close and estimate on the report generator tab, open another estimate and load another report and then attempting to open the previous estimate will load the report. But this report is possibly not designed for this estimate and may crash. In such case, you cannot open your estimate. In order to avoid this, we no longer memorize the activate tab when it’s the one or the report generator.